This case study provides an in-depth look into how Bin developed and implemented a leadership development assessment at Printify, the challenges he faced, and the lessons he learned. By taking a transparent approach and collaborating closely with stakeholders, Bin was able to design an assessment that not only highlighted the current state of leadership but also sparked meaningful reflection and action across the company.
Printify is a print-on-demand platform that operates much like Airbnb for entrepreneurs, enabling them to create and sell custom products without managing inventory. The company employs around 700 people, including 120 managers, with a hybrid and remote working setup. While employees are distributed globally, a significant portion of the workforce is based in Riga, Latvia. Bin, the Learning & Development Lead, was responsible for overseeing leadership development, ensuring that leaders at all levels aligned with the company’s vision and values.
Challenge: Designing a Leadership Development Assessment
In his third month at Printify, Bin was given a significant challenge: to design a system for assessing leadership practices across the company. His direct manager, along with senior leadership, had tasked him with creating a tool that would measure the effectiveness of leadership behaviors and practices. With a tight deadline of the year-end (September when the task was assigned), Bin faced the daunting task of figuring out where to start, what questions to ask, and who to involve in this assessment.
Bin's challenge was not only technical but also cultural, as he was relatively new to the company. He needed to gain buy-in from a wide range of stakeholders, from senior leadership to individual department heads. Despite the pressure, Bin was determined to create a meaningful and actionable leadership assessment process that would be both credible and valuable for managers across the company.
Process North Stars: Guiding Principles for Success
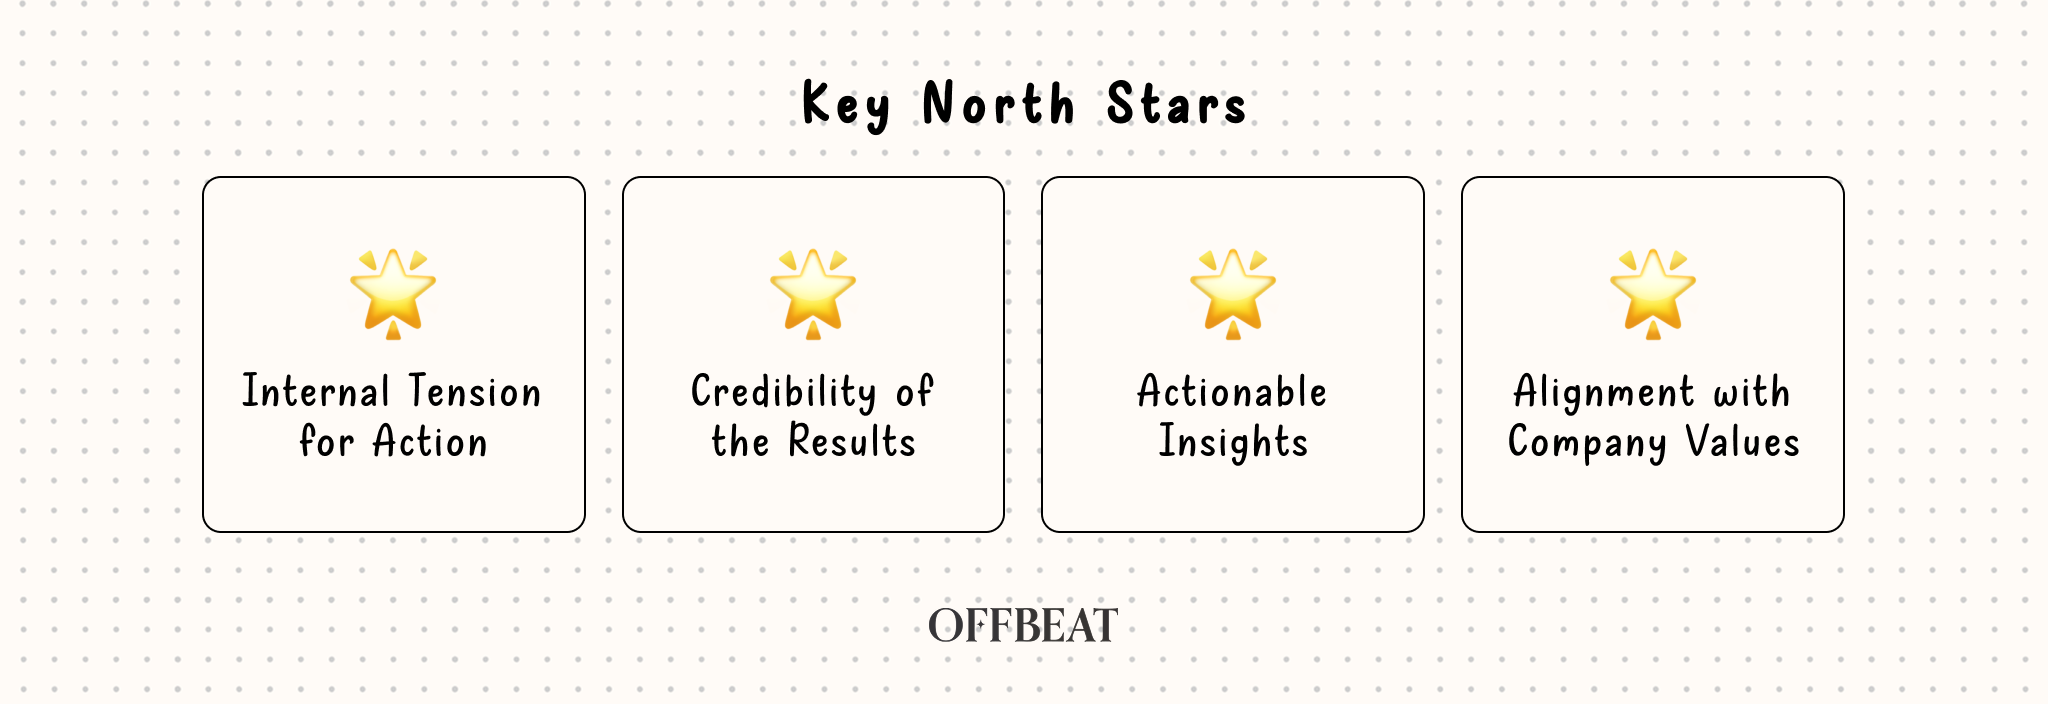
Bin outlined four key north stars that served as his guiding principles throughout the entire process. These principles helped him stay focused on the desired outcomes and ensured that each step of the leadership assessment was purpose-driven.
1. Internal Tension for Action
The first north star was to create internal tension within the managers. Bin wanted managers to be faced with the clear evidence of their leadership behavior so they could make an informed decision: either continue as they are or actively work to improve. He aimed to design the process in a way that would push managers to reflect on their own leadership effectiveness, helping them recognize where they needed to improve and where they were doing well.
2. Credibility of the Results
The second guiding principle was to ensure that the results of the leadership assessment were credible. Bin was determined that the report should not be seen as just another evaluation, but as a genuine reflection of leadership behaviors that could spark real conversations. The credibility of the results was critical for fostering honest discussions between managers and their teams, so Bin focused on making the survey questions more descriptive and observable. The assessment wasn’t just about asking abstract questions—it was about identifying the frequency of observable leadership behaviors that could be measured and acted upon.
3. Actionable Insights
The third principle Bin emphasized was that the results should lead to action. It wasn’t enough just to assess leadership behaviors; he wanted to ensure that managers had clear insights on how to improve and grow. By focusing on observable behaviors, Bin was able to create a feedback loop that encouraged managers to engage in constructive reflection. The leadership report didn’t just provide a snapshot of where managers stood; it included actionable reflection questions designed to help them move from awareness to tangible improvements.
4. Alignment with Company Values
Finally, Bin ensured that everything aligned with Printify’s leadership values. These values were the foundation for the survey and provided a consistent framework for measuring leadership behavior. By centering the assessment on these values, Bin made sure that the feedback managers received was both relevant to their personal growth and in line with the company’s broader goals and culture.
Preparation Phase: Setting the Foundation
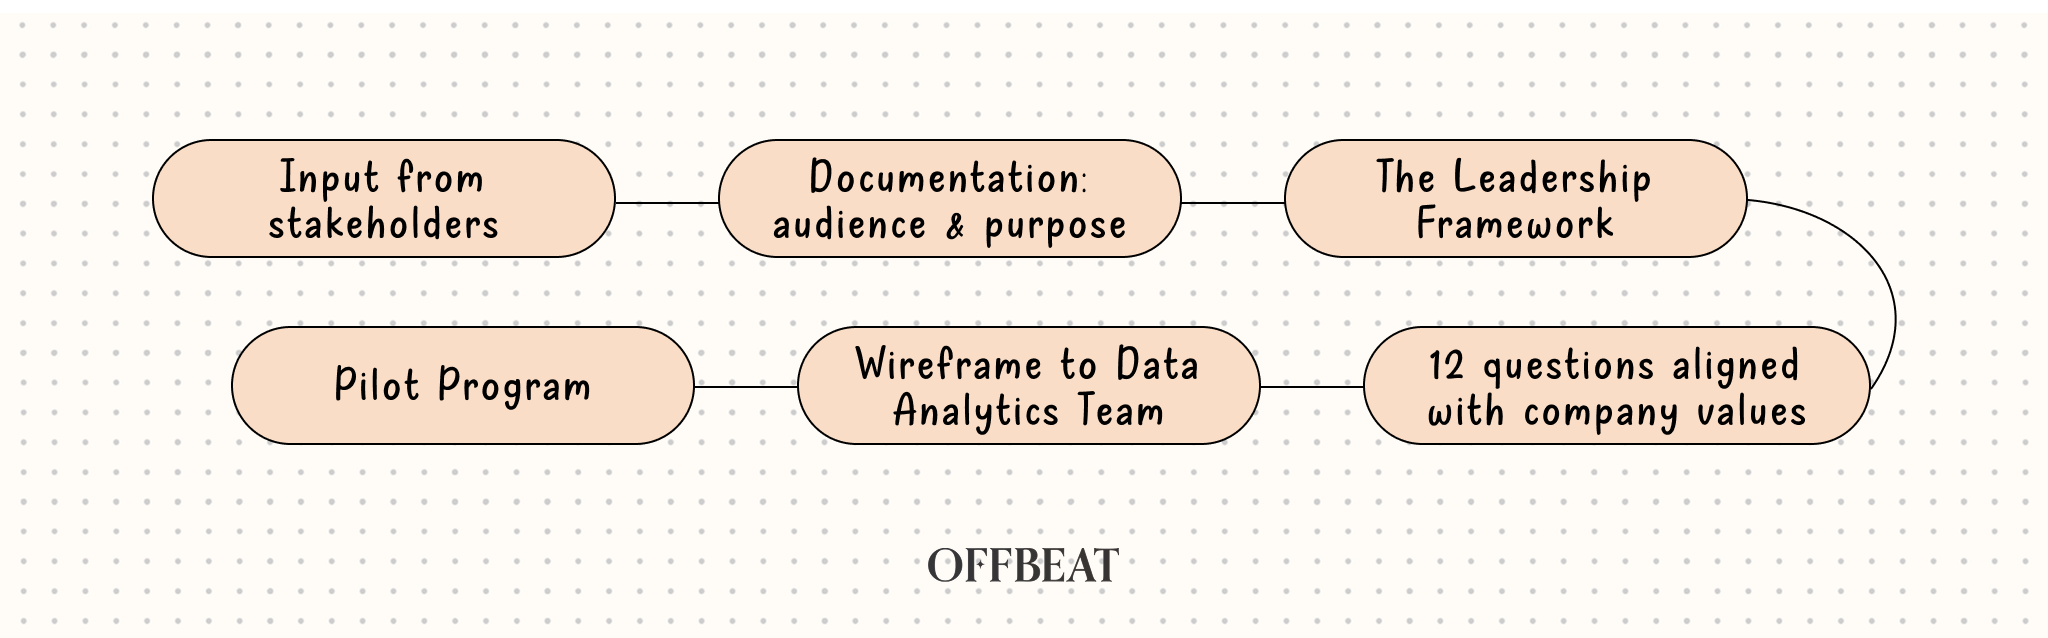
Bin’s preparation for the leadership assessment process was thorough and methodical, lasted 8 weeks, and emphasized the importance of the stakeholders at every step of the way.
Stakeholders, Stakeholders, Stakeholders
Bin began by gathering input from a broad range of stakeholders across departments and levels of seniority. He made sure to engage stakeholders early on, especially because leadership assessments can be sensitive. This helped him avoid the perception that the assessment was a “report card,” and instead framed it as a collaborative initiative. The key to gaining buy-in was ensuring that stakeholders felt heard and involved in shaping the process from the start.
Documentation: Audience & Purpose
Before diving into the survey design, Bin created comprehensive documentation that outlined the purpose of the assessment and the intended audience. This was key to setting clear expectations and ensuring everyone understood what the assessment was meant to achieve. The documentation also served as a tangible point of reference during discussions, ensuring that everyone was on the same page regarding the goals and approach.
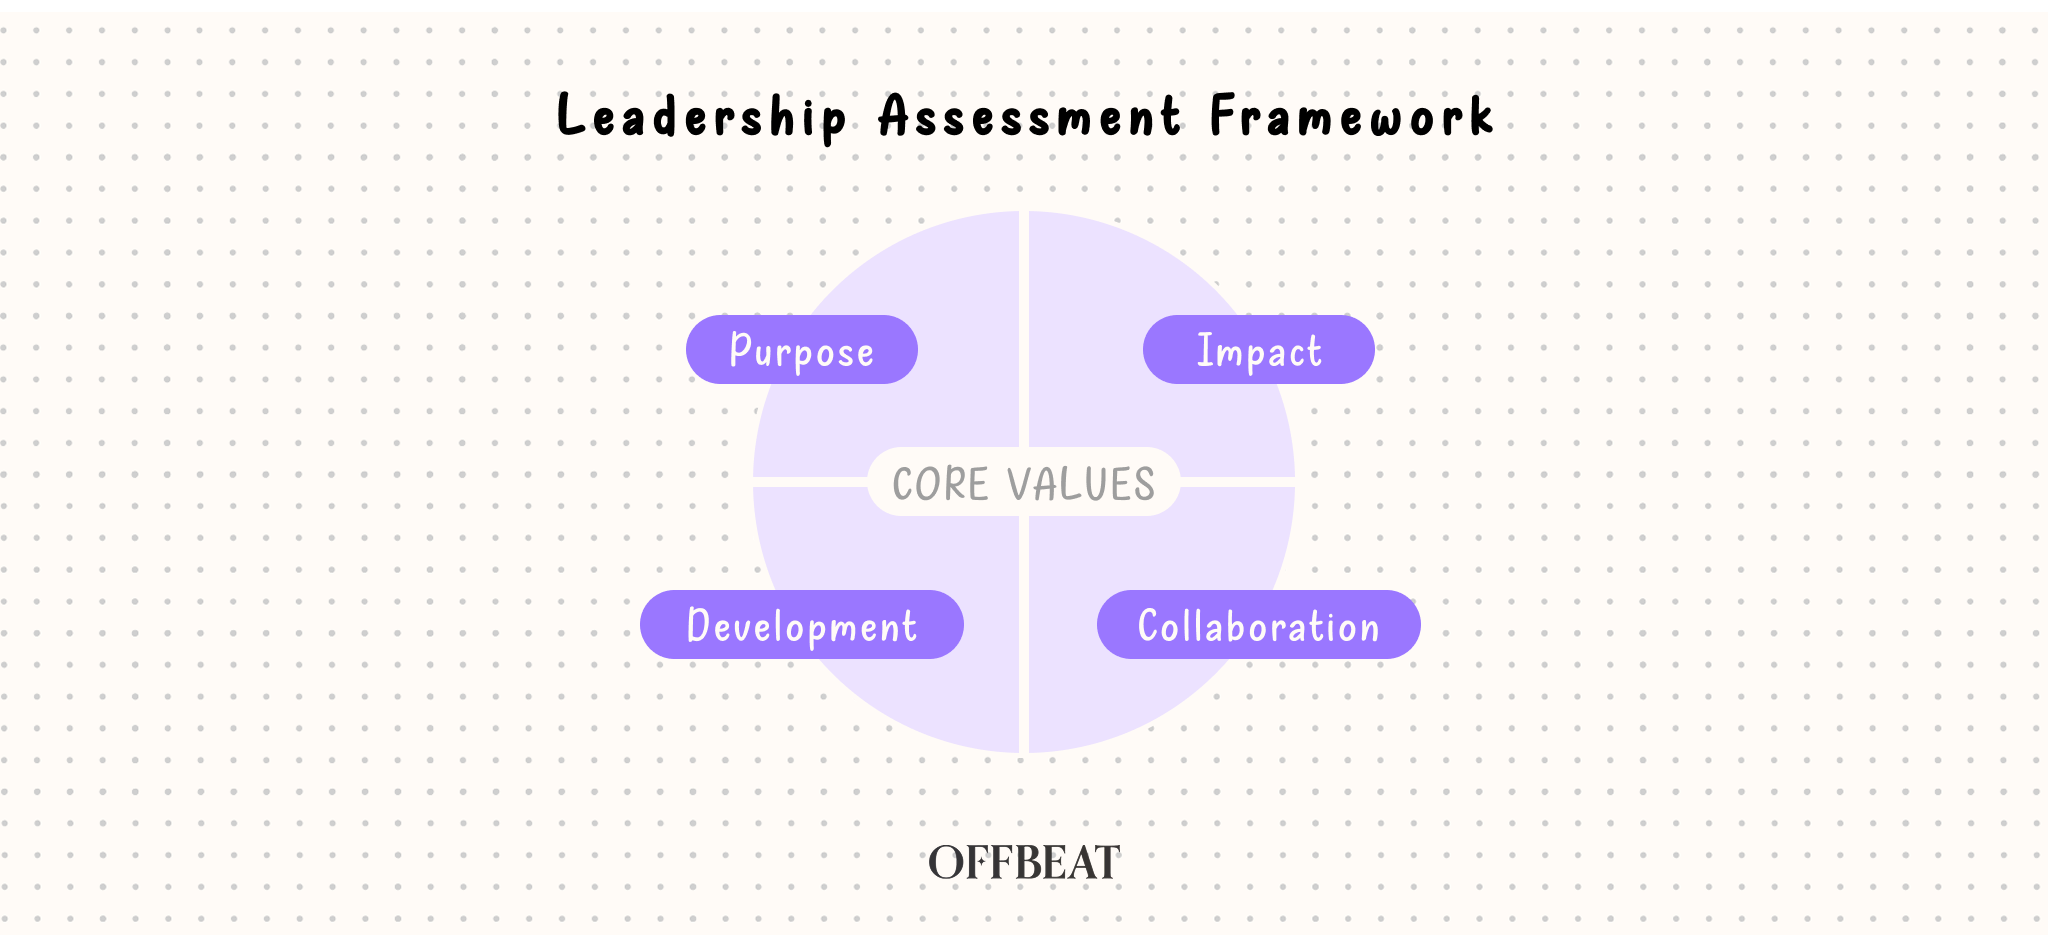
The Leadership Framework
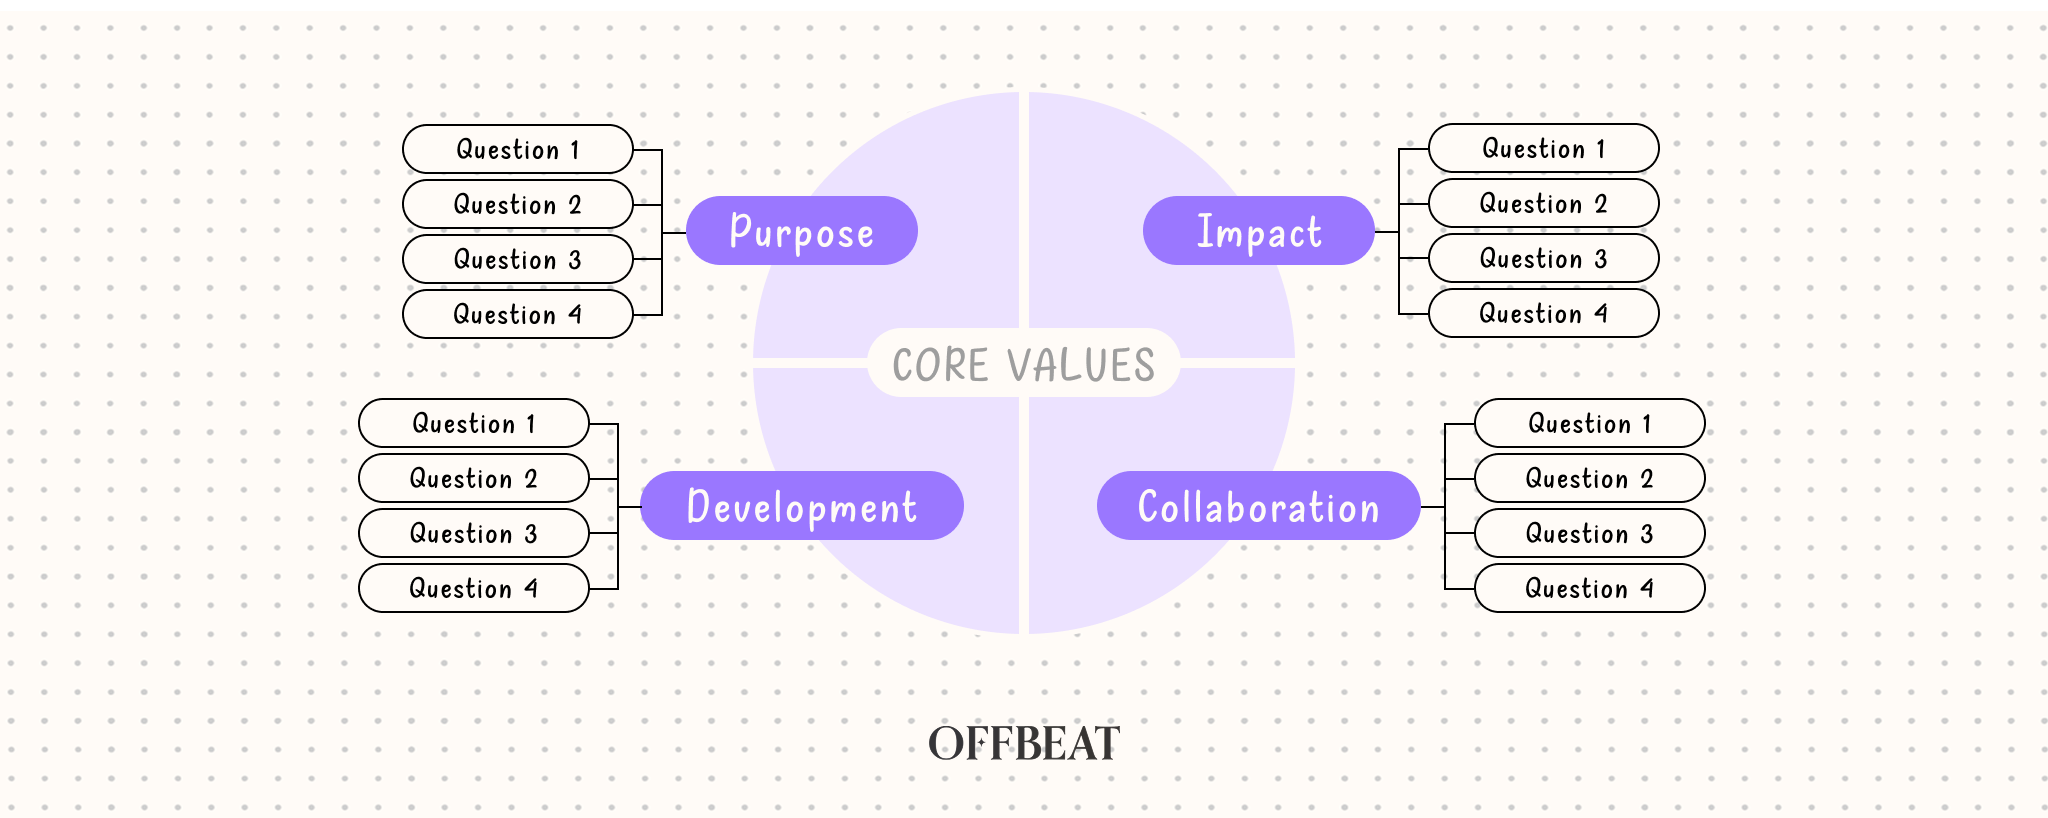
At the core of the assessment was Printify’s leadership framework. Bin worked with leadership values already established by the company – purpose, impact, development, and collaboration. These values formed the foundation for the survey questions. He structured the survey into four key leadership values, each with three questions designed to assess the frequency of observable leadership behaviors related to those values.
12 Questions = 4 Values x 3 Questions per Value
To make sure the survey was comprehensive but not overwhelming, Bin broke it down into 12 questions, which were aligned with the company’s leadership values. The survey structure was clear and focused, with four values, and each value had three questions associated with it, making a total of twelve questions. This ensured that the survey was both concise and targeted.
Pilot Program: 6 Managers & Their Teams
Bin decided to run a pilot program with six managers and their teams. The goal was to test the survey, iron out any issues, and make sure the questions were relevant and clear. The pilot group provided valuable feedback that Bin used to refine the final version of the survey. By involving managers in the pilot, Bin could also ensure that the leadership values were being interpreted and reflected properly.
Wireframe to Data Analytics Team
One of Bin’s key steps in the preparation phase was creating a wireframe for the final report and sharing it with the data analytics team. The wireframe served as a visual representation of the type of report Bin wanted to generate from the survey data. This allowed the data team to provide feedback on the design, ensuring the final output would be both visually clear and informative. Bin worked closely with the data analytics team throughout the process, adjusting the wireframe based on their input to ensure the final report was both actionable and easy to understand.
The Survey: A Two-Week Process
Bin designed the survey with simplicity and effectiveness in mind. The assessment consisted of 12 questions, each focused on observable leadership behaviors and practices, such as "How often do you communicate your team’s vision?" These questions were framed in a “how often” format to encourage managers to reflect on their actions and behaviors in concrete terms.
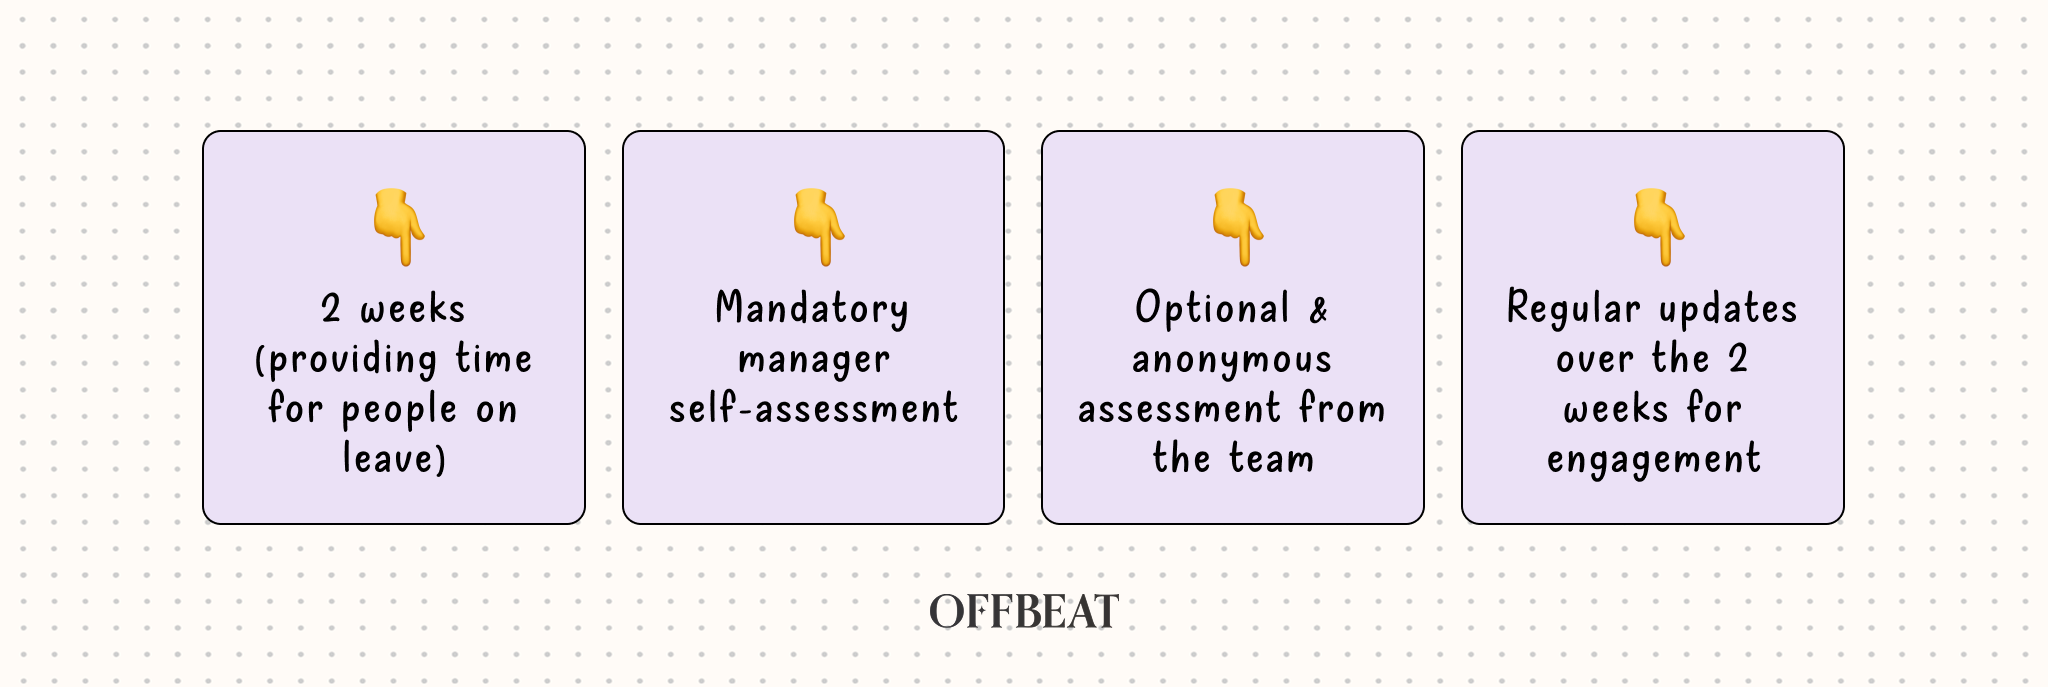
The survey ran for two weeks, providing enough time for employees on leave to participate. Managers self-assessed, while team members assessed their managers. The responses were anonymous to ensure candid feedback, and Bin made sure that team assessments were optional. This was done to enhance the credibility of the results, ensuring that no one felt forced to answer questions without enough evidence to back up their responses.
Throughout the survey period, Bin kept the teams engaged with regular updates, including friendly competition by ranking departments based on their participation rates.
Below are sample questions from the survey, aligned with the four core values that guided the assessment:
Purpose Sample Question: "How often do you communicate our team's vision, if any, in a manner relevant to your own area of responsibilities?"
Impact Sample Question: "How often do you initiate changes to proactively address future opportunities and challenges?"
Development Sample Question: "How often do you openly recognize my limitations and weaknesses?"
Collaboration Sample Question: "How often do you make efforts to rebuild broken trust?"
The Report: From Data to Action
Once the survey was completed, Bin collaborated closely with the data analytics team to visualize the results. Their goal was to create a meaningful, individualized report that managers could use to assess their own leadership practices and identify areas for improvement.
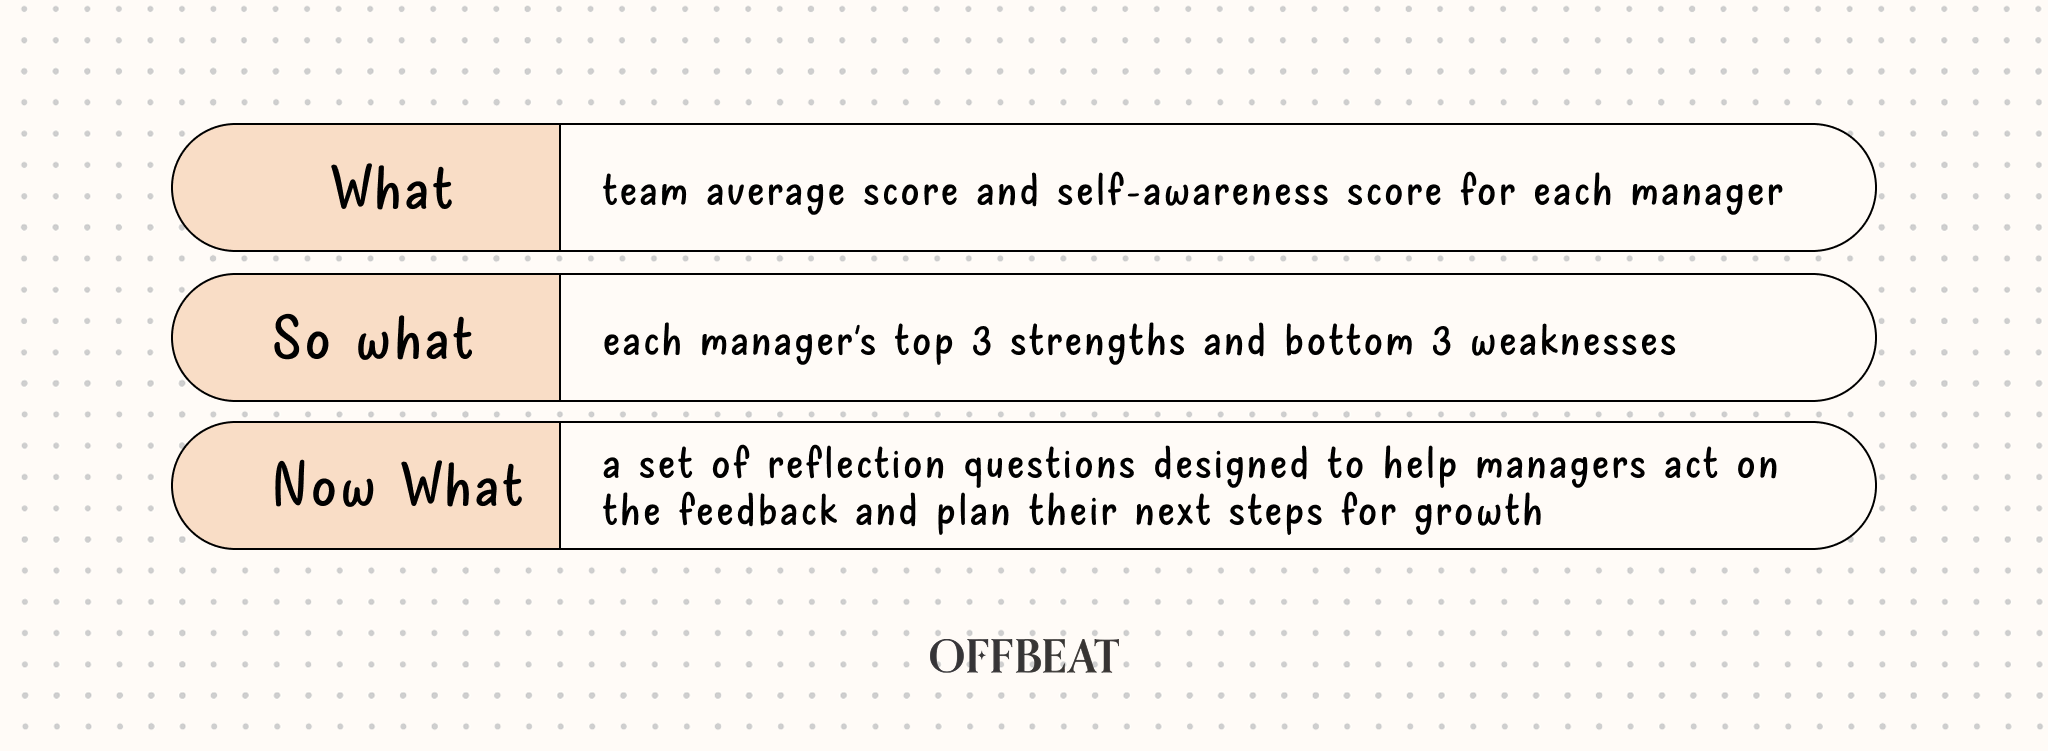
The final report was divided into three key sections:
What: This section presented the raw survey results, including the team average score and self-awareness score for each manager. The team average score was calculated based on team members’ feedback, while the self-awareness score was derived from the difference between the manager’s self-assessment and their team’s assessment. This score revealed how accurately managers perceived their own behavior in comparison to their teams’ perceptions.
So What: In this section, the results were interpreted to highlight each manager’s top 3 strengths and bottom 3 weaknesses, based on the survey responses. The interpretation also identified the top 3 positive blind spots (where managers underestimated their effectiveness) and bottom 3 negative blind spots (where they overestimated their effectiveness). For example, if a manager thought they were providing inadequate feedback but their team rated them highly, this would be considered a "positive blind spot," showing they were more effective than they believed.
Now What: This section provided a set of reflection questions designed to help managers act on the feedback and plan their next steps for growth. The reflection questions prompted managers to reflect on their results, identify key areas for development, and create actionable goals.
Bin also included participation rates and response counts per question in the report to ensure that managers could assess the credibility of the data. This transparency allowed managers to understand how many team members contributed to each question, helping them gauge the reliability of the feedback.
The emphasis on providing managers with actionable insights through the report was key in encouraging genuine reflection and personal growth.
Reflection and Action
To ensure that the feedback from the leadership assessment translated into real changes, Bin organized a Facilitator-led Reflection Session that was 1 hour synchronous but not mandatory. The session aimed to help managers internalize the feedback and identify specific actions for growth.
To help managers reflect on their leadership feedback, Bin used a structured approach during the Facilitator-led Reflection Session. This framework was designed to guide managers through a process of self-assessment and goal-setting. The session encouraged managers to dig deeper into the feedback, explore their leadership practices, and take actionable steps for improvement. Here are the questions used in the session:
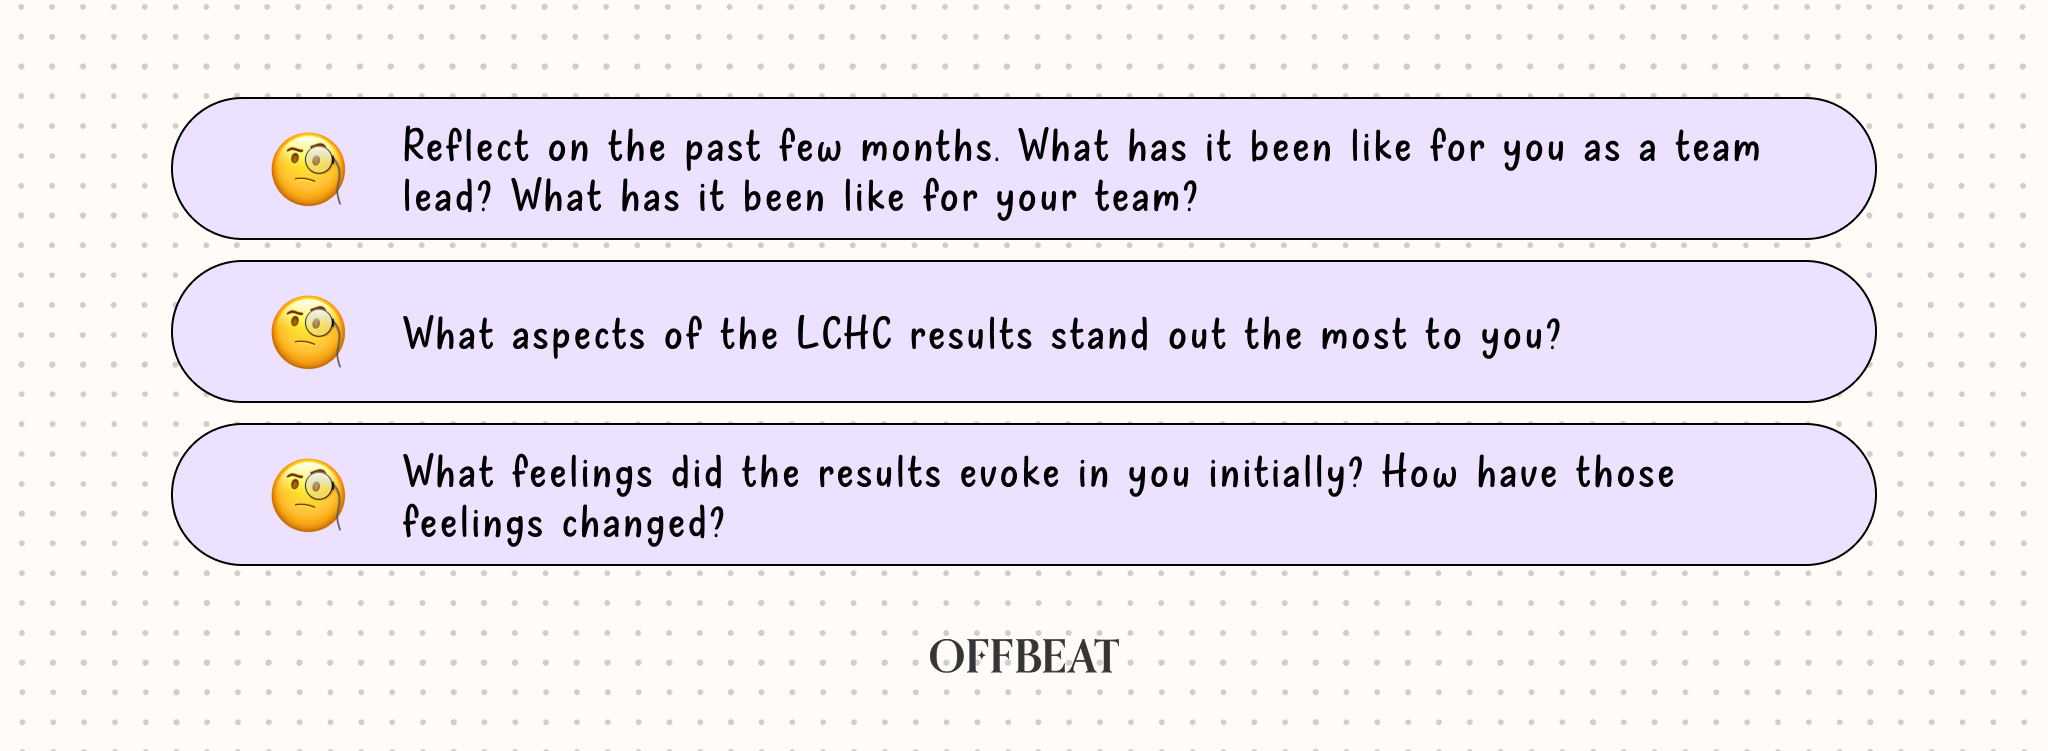
What?
The first step of the reflection process was focused on understanding the current state of leadership. Managers were prompted to reflect on their recent experiences and the feedback they received. The goal was to explore how they perceived their leadership and what aspects stood out to them:
Reflect on the past few months. What has it been like for you as a team lead? What has it been like for your team?
What aspects of the LCHC results stand out the most to you?
What feelings did the results evoke in you initially? How have those feelings changed?
These questions were intended to help managers process their feedback, connect it to their experiences, and understand the emotional response it triggered.
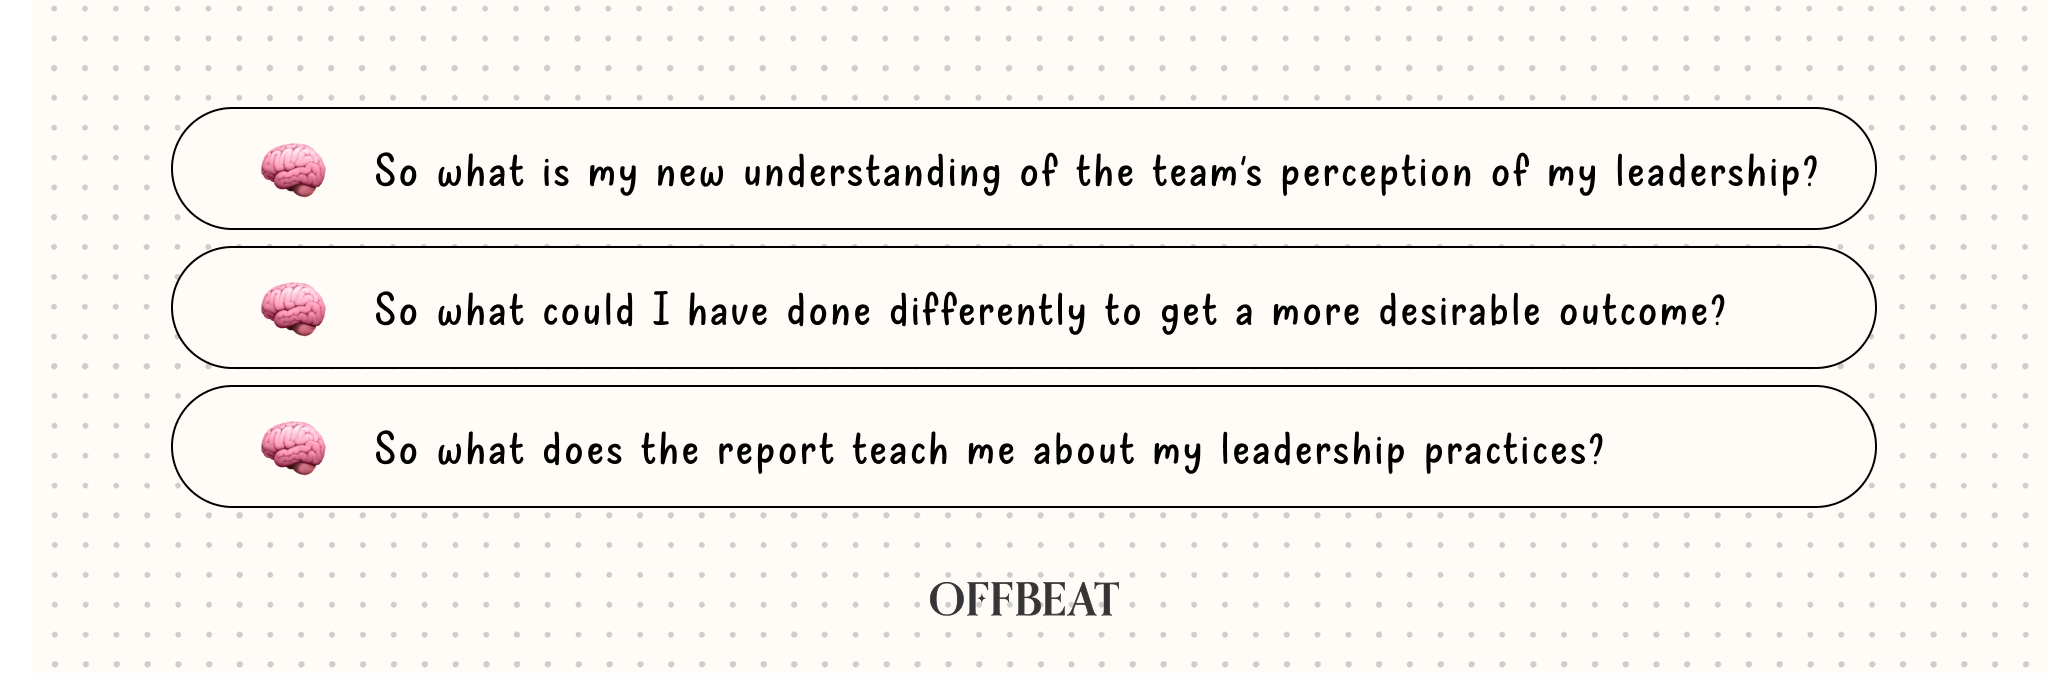
So What?
Once managers understood the feedback, the next phase encouraged deeper analysis. The "So What?" questions focused on interpreting the data and understanding the implications of the results. These questions helped managers identify key takeaways and areas for growth:
So what is my new understanding of the team's perception of my leadership?
So what could I have done differently to get a more desirable outcome?
So what does the report teach me about my leadership practices?
The "So What" questions encouraged managers to connect the feedback to their leadership behaviors, identify patterns, and begin to form a clearer picture of areas for improvement.
Now What?
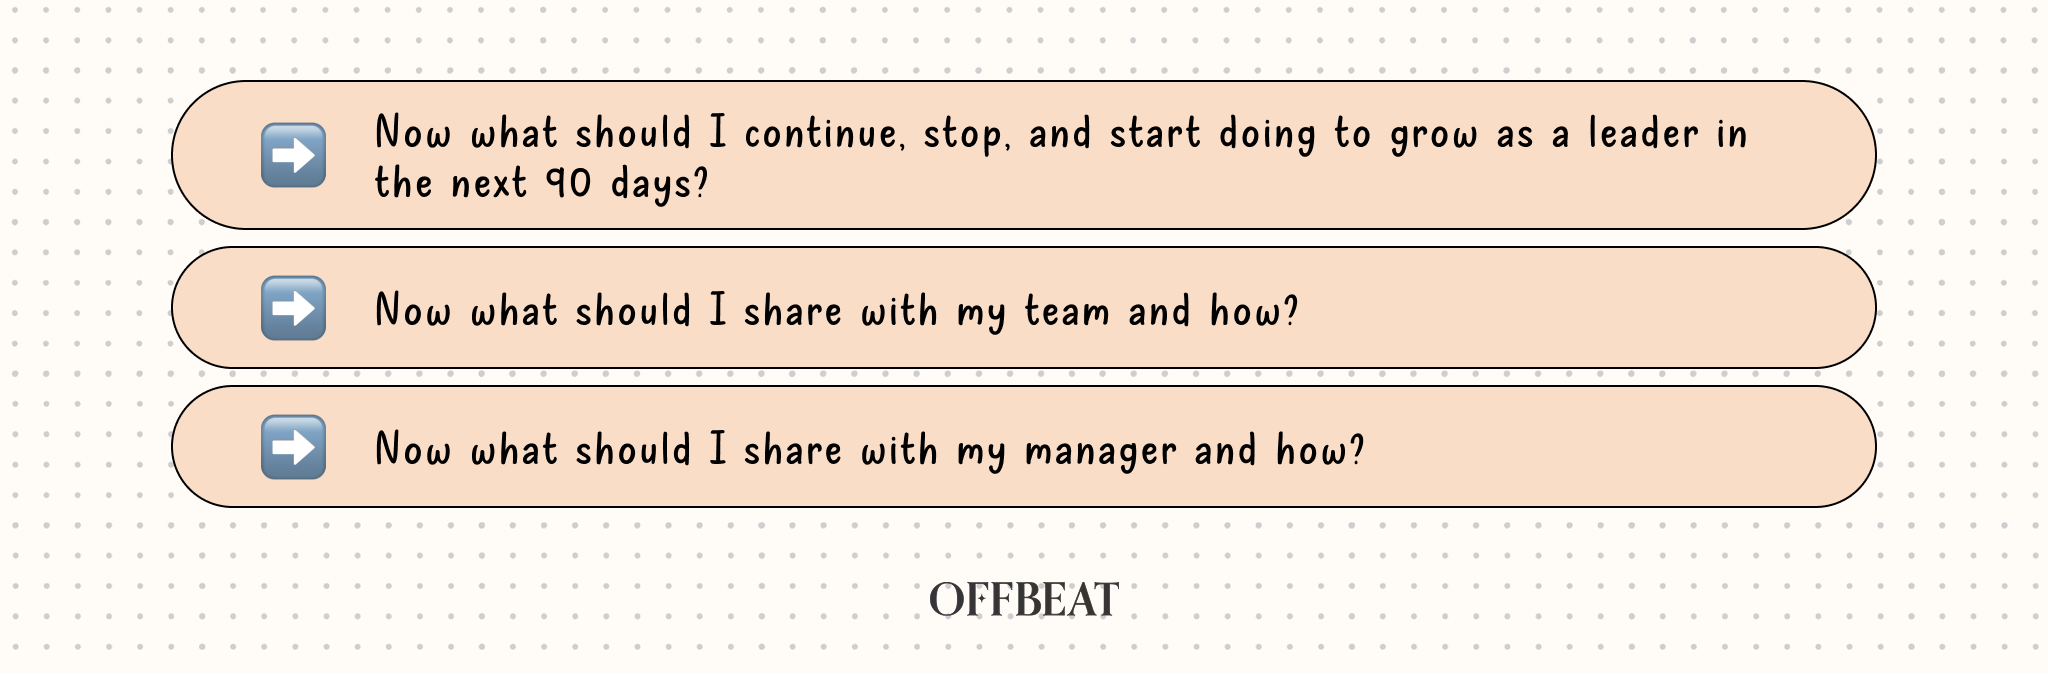
The final step of the reflection session focused on creating actionable next steps. The "Now What?" questions were aimed at translating the insights into concrete actions for development:
Now what should I continue, stop, and start doing to grow as a leader in the next 90 days?
Now what should I share with my team and how?
Now what should I share with my manager and how?
These questions pushed managers to commit to tangible actions, ensuring they were not only reflecting but also planning for meaningful growth and improvement.
However, despite its value, attendance was lower than expected, with only six managers attending.
Bin recognized that stronger buy-in from senior leadership was needed for the process to be taken more seriously.
Results & Lessons Learned
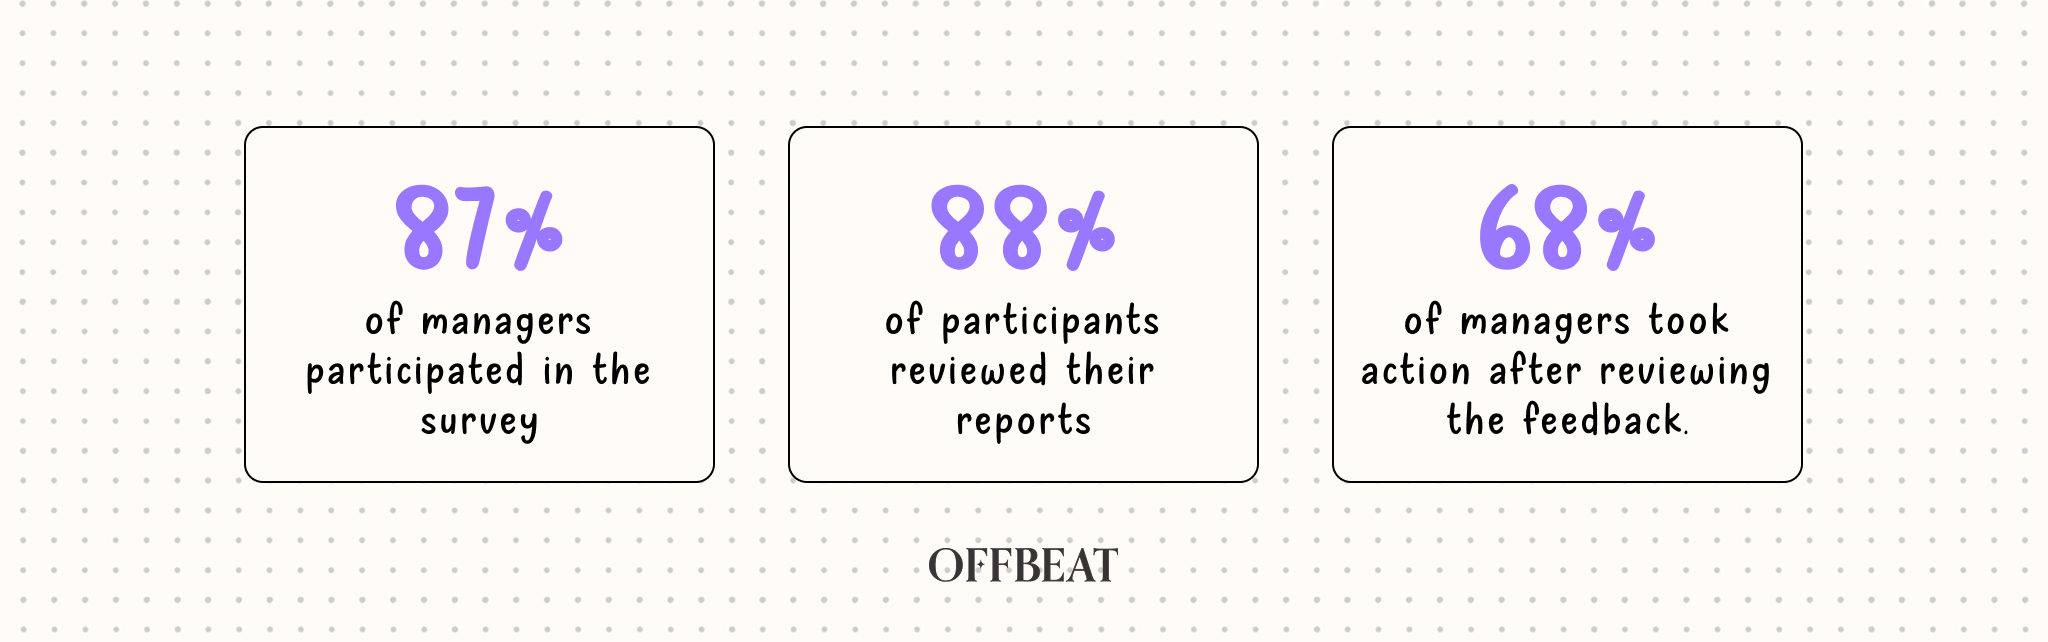
Survey Participation:
87% of managers participated in the survey.
88% of participants reviewed their reports.
68% of managers took action after reviewing the feedback.
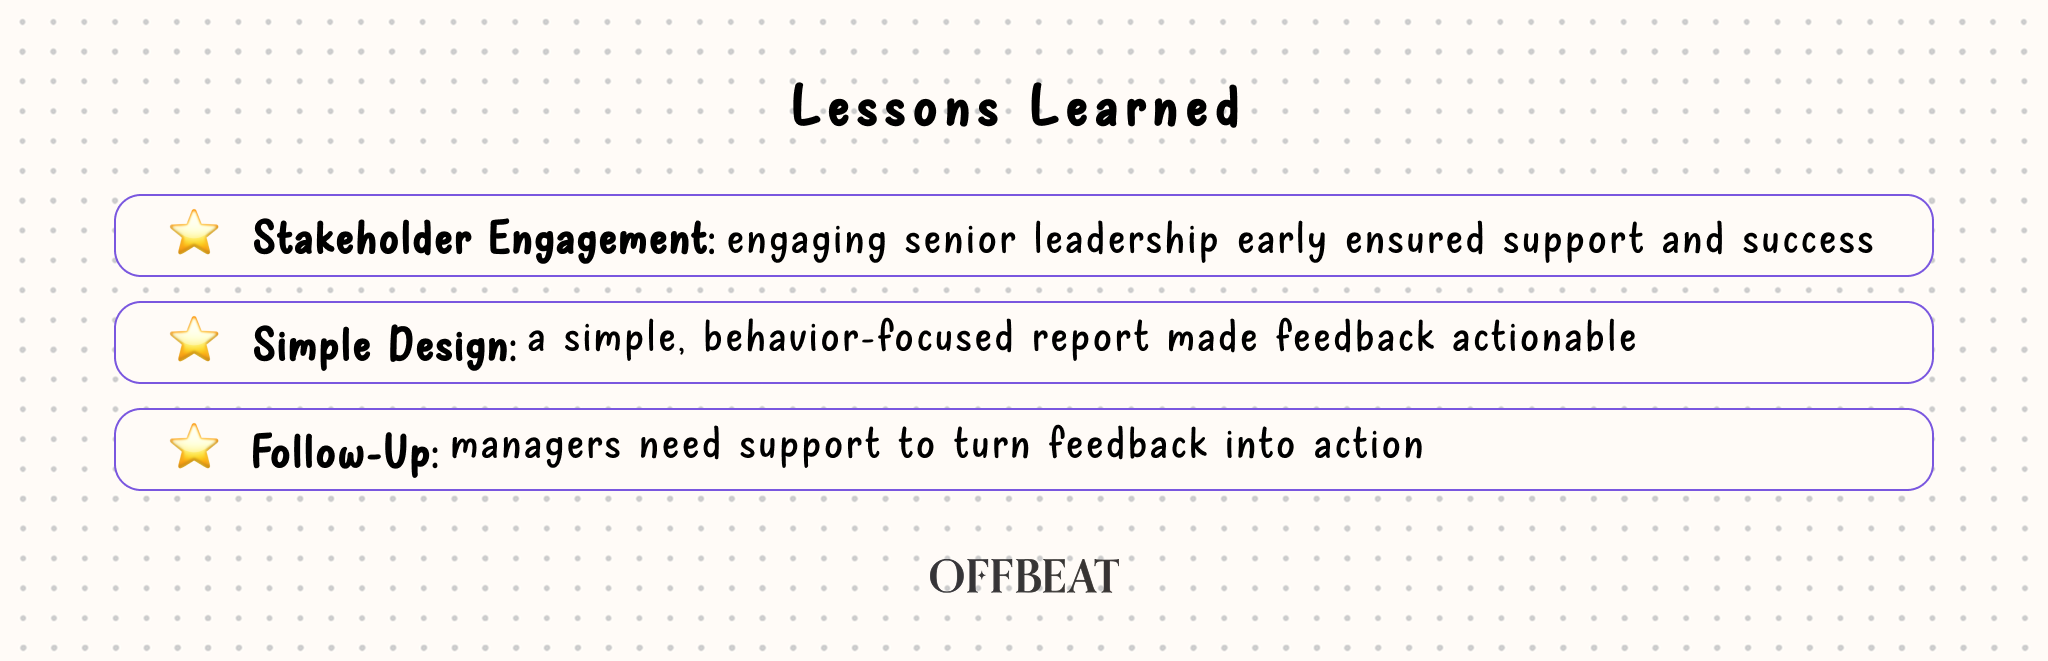
Lessons Learned:
Stakeholder Engagement: Engaging senior leadership early on was key to securing buy-in and ensuring that the project had the necessary support to succeed.
Simple Design: Making the report simple and focusing on observable behaviors helped ensure that the feedback was clear and actionable for managers.
Follow-Up: While the survey results were valuable, Bin learned that follow-up support and reflection sessions were necessary to drive real change. Managers need more encouragement to act on feedback.
Expected vs Events
What Bin Expected:
People's confusion on question word choice.
People not understanding the report.
Not many people attending Reflection & Action session.
What Happened:
Outdated HR date structure in Lattice was discovered.
There was very good participation overall.
Stakeholders supported the initiative, ensuring its success.
Managers took action based on the feedback.
What Bin Didn't Expect:
People storming Slack with questions and strong emotions.
People not reading the wiki, which resulted in low participation.
No negative impact at all.
People not seeing it as a control mechanism but as a constructive feedback tool.
Unexpected Outcome:
"My hard work will send an orange-striped cat with white feet to my doorsteps."
Challenges & Future Directions
Despite the successes, Bin faced several challenges that he plans to address moving forward:
Increasing Participation in Reflection Sessions: With only six managers attending the reflection sessions, Bin is exploring ways to involve senior leadership more proactively to increase attendance and engagement.
Using Data for Long-Term Leadership Development: Bin is looking into how the results of this leadership assessment can inform future leadership development initiatives and ensure that leadership growth is an ongoing process.
Improving the Process: Bin plans to improve the clarity of the reports and make the reflection sessions more engaging and practical for all participants.
This case study is an experiment as we explore ways to bring valuable L&D case studies to our Offbeat Fellows. Your feedback will help us decide whether to continue showcasing case studies in this format. Please keep this within the Fellowship.